Calculate skewness and kurtosis based on truncated normal distribution in one group
Source:R/destrunc.R
destrunc.RdThis function can be used to calculate the skewness and kurtosis based on the truncated normal distribution. Also, it can be used to estimate the mean and variance of the parent distribution (the distribution before truncated).
Arguments
- vmean
sample mean of the truncated data
- vsd
sample standard deviation of the truncated data
- lo
minimum possible value
- hi
maximum possible value
- rawdata
when raw data is available, we could still use it to check it figuratively, if the data was closed to the normal distribution, or truncated normal distribution.
- showFigure
when showFigure = TRUE, it will display the plots with theoretical normal curve and the truncated normal curve.
- xstart
see the package
nleqslv- btol
see the package
nleqslv- ftol
see the package
nleqslv- ...
other arguments
Value
If `showFigure = TRUE`, the output will be a list with two objects: one is the data frame of parent mean and standard deviation (pmean and psd), mean and standard deviation of truncated normal distribution (mean and sd), and skewness and kurtosis; the other is the theoretical figures of beta and normal distributions. If `showFigure = FALSE`, the output will be only the data frame.
References
Shah SM, Jaiswal MC (1966). “Estimation of parameters of doubly truncated normal distribution from first four sample moments.” Annals of the Institute of Statistical Mathematics, 18(1), 107--111.
Robert CP (1995). “Simulation of truncated normal variables.” Statistics and computing, 5(2), 121--125.
Barr DR, Sherrill ET (1999). “Mean and variance of truncated normal distributions.” The American Statistician, 53(4), 357--361.
Examples
data("trun_mdat")
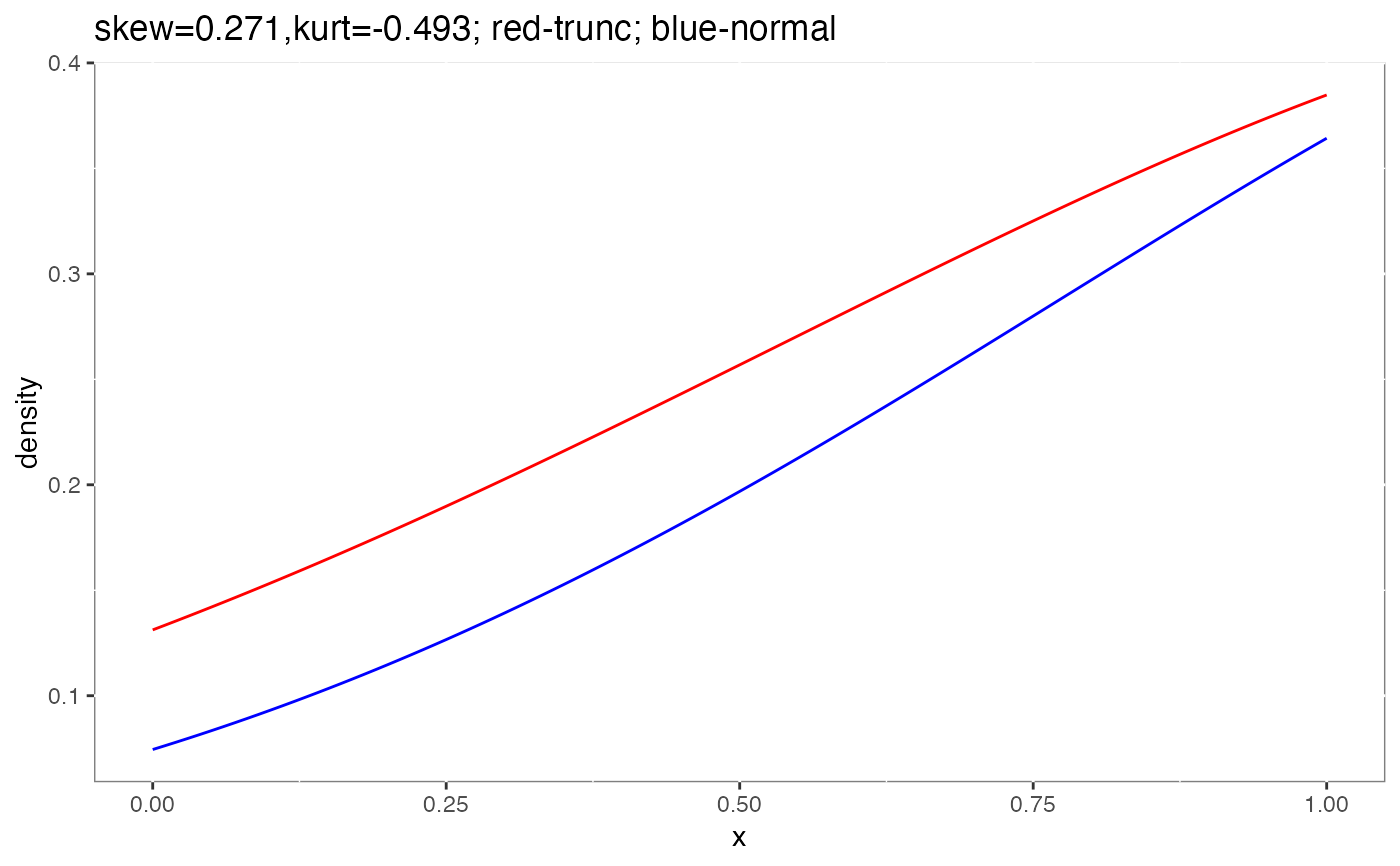
destrunc(vmean=trun_mdat$m2[6], vsd=trun_mdat$sd2[6],
hi = 4, lo = 0, showFigure = TRUE)
#> $dat
#> pmean psd tm tsd skewness kurtosis
#> 1 1.505538 0.9667249 1.613387 0.8375352 0.2713042 -0.4927465
#>
#> $fig
 #>
#example2
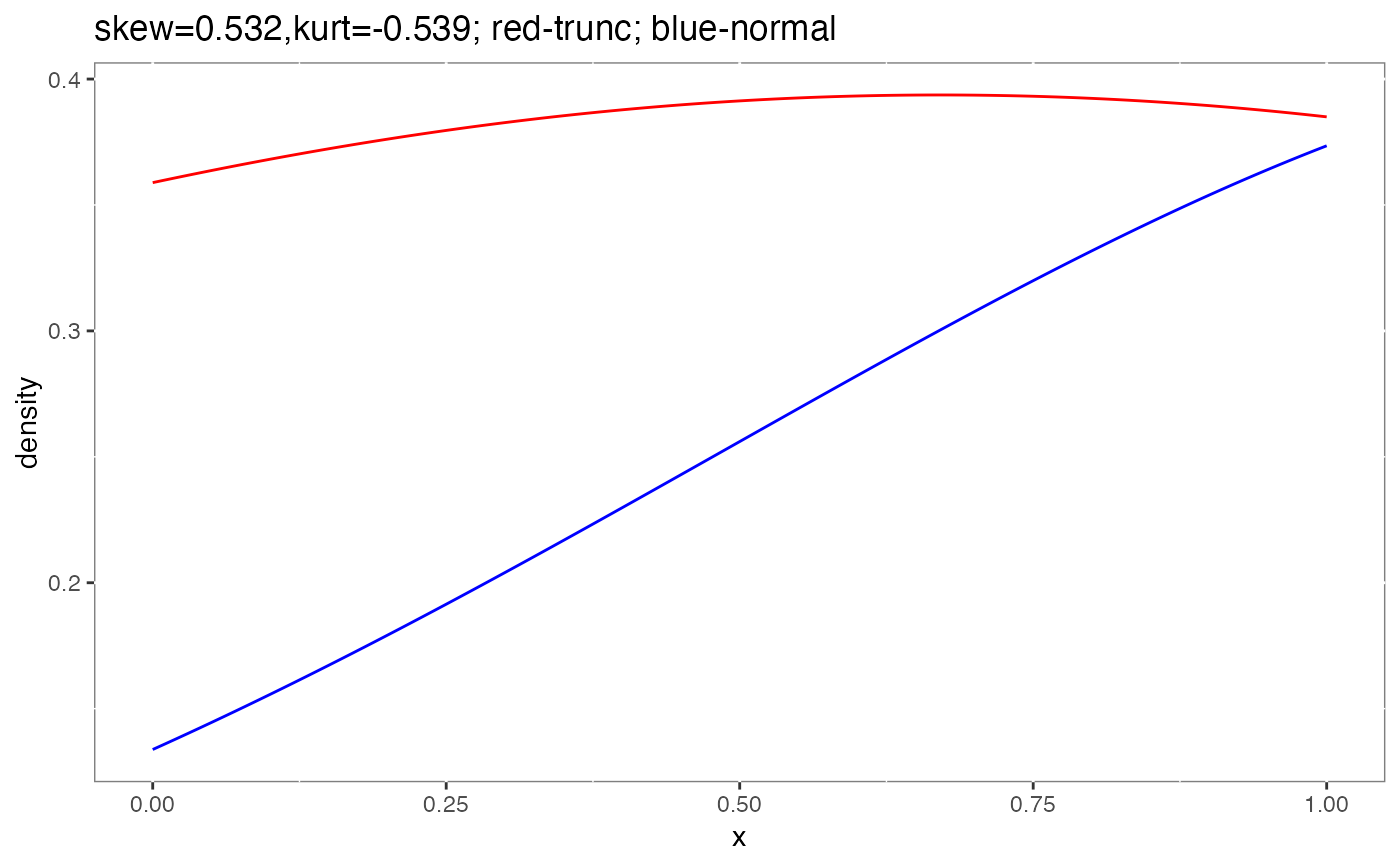
destrunc(vmean=trun_mdat$m1[17], vsd=trun_mdat$sd1[17],
hi = 4, lo = 0, showFigure = TRUE)
#> $dat
#> pmean psd tm tsd skewness kurtosis
#> 1 0.6706224 1.55863 1.44477 0.9592371 0.5321831 -0.5392483
#>
#> $fig
#>
#example2
destrunc(vmean=trun_mdat$m1[17], vsd=trun_mdat$sd1[17],
hi = 4, lo = 0, showFigure = TRUE)
#> $dat
#> pmean psd tm tsd skewness kurtosis
#> 1 0.6706224 1.55863 1.44477 0.9592371 0.5321831 -0.5392483
#>
#> $fig
 #>
#>