Calculate skewness and kurtosis based on Beta distribution in one group
Source:R/desbeta.R
desbeta.RdThis function can be used to calculate the skewness and kurtosis based on the Beta distribution. Also, this function estimate the shape parameters alpha and beta.
Arguments
- vmean
sample mean of the truncated data
- vsd
sample standard deviation of the truncated data
- lo
minimum possible value
- hi
maximum possible value
- method
when method = 'MM', the method used is the method of moments, when method = "ML', the method used to estimate the distribution is maximum likelihood
- rawdata
when raw data is available, we could still use it to check it figuratively, if the data was closed to the normal distribution, or truncated normal distribution.
- showFigure
when showFigure = TRUE, it will display the plots with theoretical normal curve and the truncated normal curve.
- ...
other arguments
Value
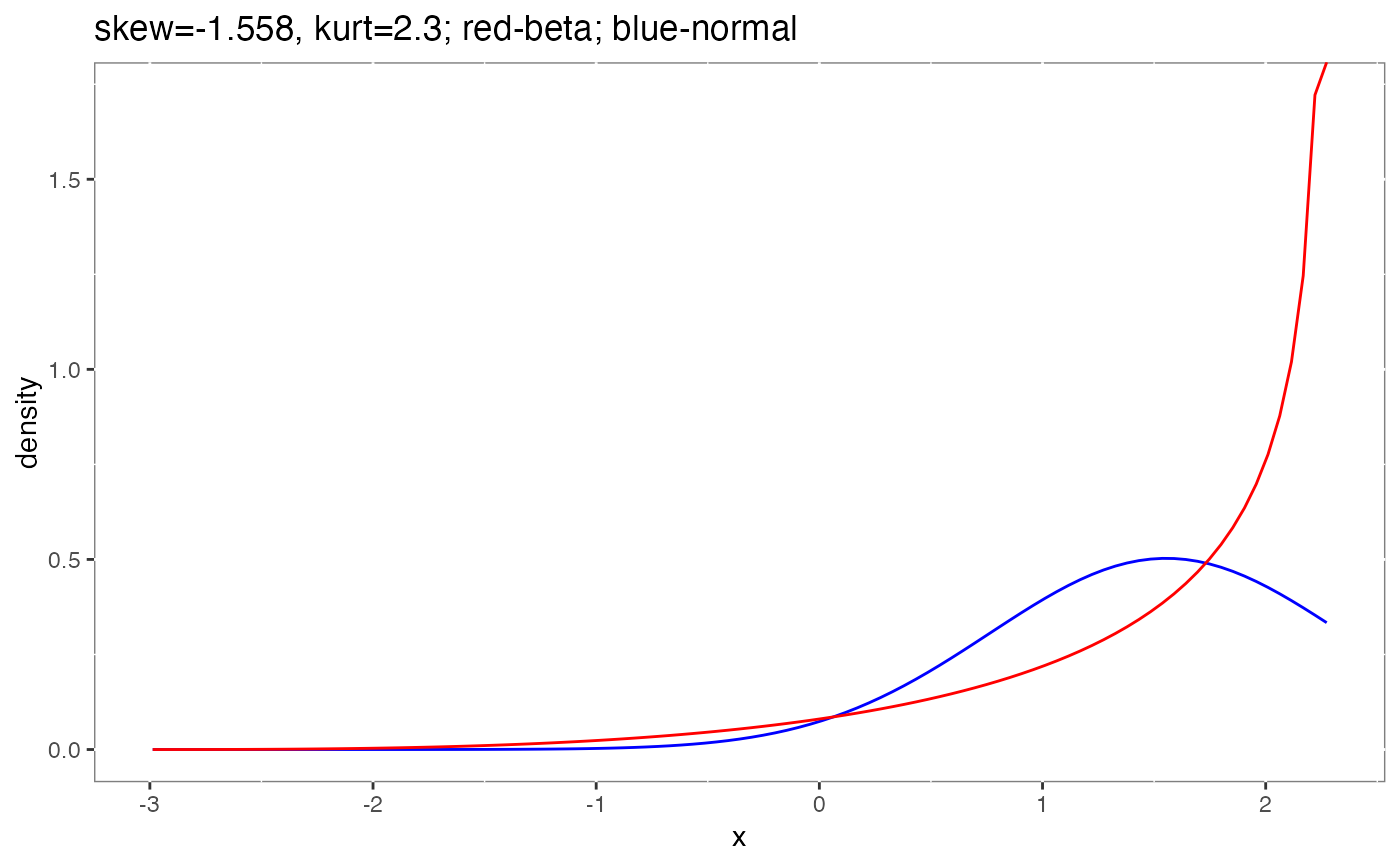
If `showFigure = TRUE`, the output will be a list with two objects: one is the data frame of shape parameters (alpha and beta), mean and standard deviation of standard beta distribution (mean and sd), and skewness and kurtosis; the other is the theoretical figures of beta and normal distributions. If `showFigure = FALSE`, the output will be only the data frame.
References
Johnson NL, Kotz S, Balakrishnan N (1995). “Continuous univariate distributions.” In volume 289, chapter 25 Beta Distributions. John wiley & sons.
Smithson M, Verkuilen J (2006). “A better lemon squeezer? Maximum-likelihood regression with beta-distributed dependent variables.” Psychological methods, 11(1), 54.
Examples
data('beta_mdat')
desbeta(vmean=beta_mdat$m2[6], vsd=beta_mdat$sd2[6],
hi = beta_mdat$hi2[6], lo = beta_mdat$lo2[6], showFigure = TRUE)
#> $dat
#>      alpha      beta      mean        sd  skewness kurtosis
#> 1 3.614481 0.5718672 0.8633971 0.1508011 -1.558126 2.299977
#>
#> $fig

#>
#>